Drone LiDAR Topographic Survey at 265 Riccarton Road: Checking the Accuracy
A drone LiDAR topographic survey of a Christchurch construction site, tied to three surveyed control points and checked against two independent points. Here are the real accuracy numbers, and what they mean.
By Art Ryumin3 min read265 Riccarton Road, Christchurch
- check-point RMSE (independent)
- 0.033 m
- check-point RMSE (independent)
- control-point RMSE
- 0.013 m
- control-point RMSE
- largest check-point difference
- 0.040 m
- largest check-point difference
- control + independent check points
- 3 + 2
- control + independent check points
Anyone can say a survey is "centimetre accurate". The useful question is: checked against what?
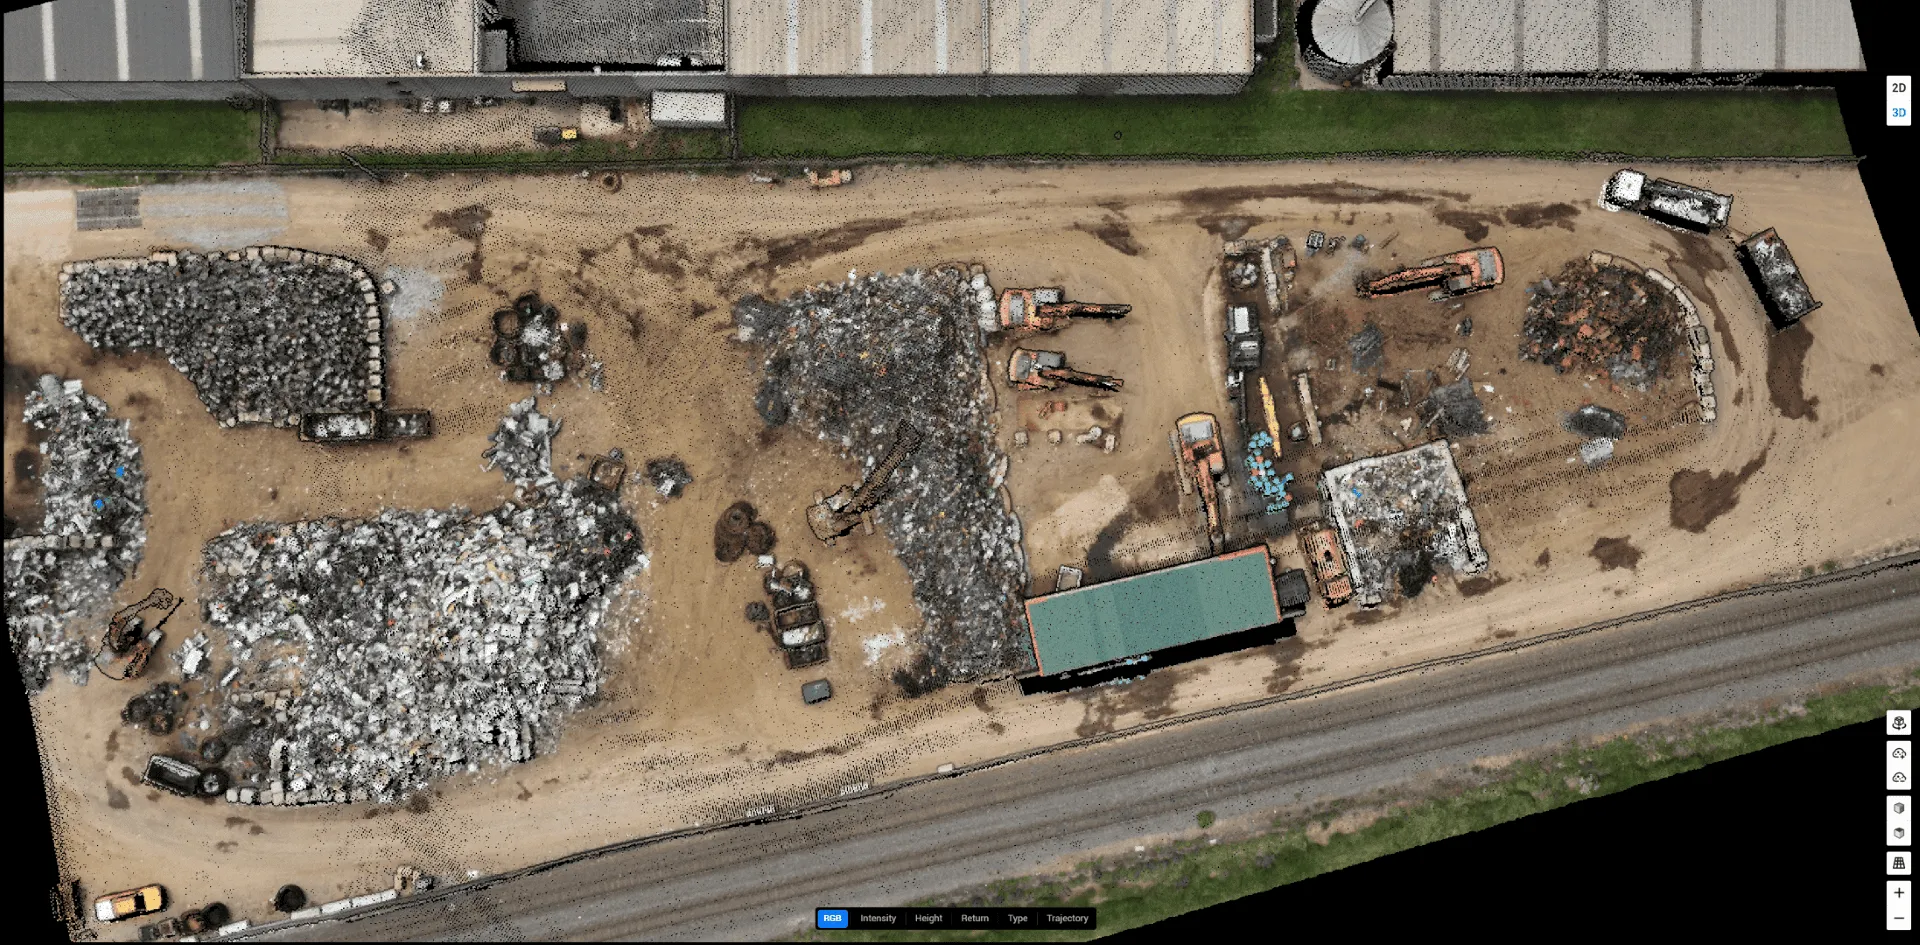
On this construction site at 265 Riccarton Road in Christchurch, we captured the ground with drone LiDAR and then did what every topographic survey we deliver includes. We tested the finished surface against surveyed points that played no part in producing it, and reported the numbers.
How the survey was captured
The site was flown with our DJI Matrice 350 RTK carrying a Zenmuse L2 LiDAR sensor, on a planned, overlapping pattern at a fixed height above ground. LiDAR captures thousands of ground points per square metre, so a cluttered construction site can be recorded in one visit without anyone walking over excavations or around operating plant.
The accuracy process has four layers:
- RTK positioning. The aircraft flies with RTK and PPK corrections, so the point cloud is positioned to centimetre level before any control is applied.
- Ground control. Three surveyed marks on site were used to tie the dataset to the survey coordinate system.
- Independent check points. Two further surveyed marks were held back and never used in the correction. They exist purely to test the result.
- Ground classification review. Automated classification separated ground from non-ground, followed by manual review of edges, stockpile faces and mounds, so plant, vehicles and temporary objects don't distort the terrain surface.
The results
| Points | Count | Average difference | Maximum difference | RMSE |
|---|---|---|---|---|
| Control points (used to correct the dataset) | 3 | 0.008 m | 0.013 m | 0.013 m |
| Check points (independent, not used in the correction) | 2 | 0.024 m | 0.040 m | 0.033 m |
What these numbers actually mean
The control points show how well the dataset was fitted. Because they were used to correct the data, you'd expect them to agree closely, and they do: an RMSE of 13 mm.
The check points show how well the survey holds up where it wasn't adjusted. This is the number that matters to a design team. With an RMSE of 33 mm and a largest difference of 40 mm, the surface sits within a few centimetres of independently surveyed ground.
The caveats
This is a single site with a small number of check points, so treat it as an indicative result rather than a guarantee. Accuracy varies with vegetation, surface type and the control available.
LiDAR measures what the laser can see. Accuracy under dense low scrub, long grass, ponded water and very reflective surfaces is lower than on open hard ground, and we flag those areas in the accuracy statement. LiDAR doesn't locate buried services or legal boundaries. That's work for a traditional or cadastral surveyor, and we're happy to work alongside them on the same control.
What a topographic survey delivers
Every LiDAR topographic survey we deliver includes a written accuracy statement alongside data your team can open directly:
- Classified point cloud: LAS 1.4 (LAZ on request)
- Ground terrain surface (TIN): DXF and LandXML for Civil 3D, 12d and other CAD software
- Contours: DXF, at 0.25 m, 0.5 m, 1 m or 2 m intervals
- Digital elevation model: GeoTIFF for GIS, drainage and flood modelling
- Gridded points: CSV or DXF for earthworks and quantity take-offs
- Accuracy statement: control and check-point results, coordinate system and method