TL;DR — The Short Version
We completed a LiDAR drone survey for a recycling facility in Woolston, Christchurch — measuring five separate material stockpiles totalling over 7,149m³ in a single flight. Results are accurate to within 2% of true volume.
Traditional stockpile measurement is slow, imprecise, and often requires someone to physically climb the pile — a genuine health and safety risk. LiDAR drone surveys are faster, safer, and significantly more accurate.
Key takeaway: If your business manages stockpiles, quarries, earthworks, or bulk materials — there’s a better, faster, and more accurate way to measure them.
In early December 2025, we flew a LiDAR survey at a resource recycling facility in Woolston, Christchurch. The client needed accurate volume and weight measurements across five distinct stockpiles of different materials — each with different densities, different physical characteristics, and all sitting in a working yard where operations couldn’t stop.
One flight. Five stockpiles. 7,149m³ of material measured. Results back within a week.
Here’s how it worked, what we found, and why this kind of survey is fast becoming the standard for any New Zealand business that deals in bulk materials.
The Problem With Traditional Stockpile Measurement
If you’ve ever had to measure a stockpile the old way, you know how time-consuming and inaccurate it can be. Someone walks the perimeter with a GPS unit or measuring wheel. Someone else climbs the pile — a health and safety issue on its own — to take height readings at various points. The data gets fed into a spreadsheet, assumptions get made about the shape of the pile, and you end up with a number that might be accurate to within 10-15% if you’re lucky.
For a business managing significant material inventory, a 10-15% measurement error isn’t acceptable. And for irregular-shaped piles with concave sections, overhangs, or retaining walls — which is most real-world stockpiles — manual measurement gets even less reliable.
The Woolston site had exactly this complexity. Five stockpiles of different recycled materials, three of them partially retained by concrete block walls. Getting accurate volumes meant we needed to account for the wall volumes themselves and subtract them from the total — something that requires precise 3D data, not a tape measure.

What LiDAR Actually Does — In Plain Language
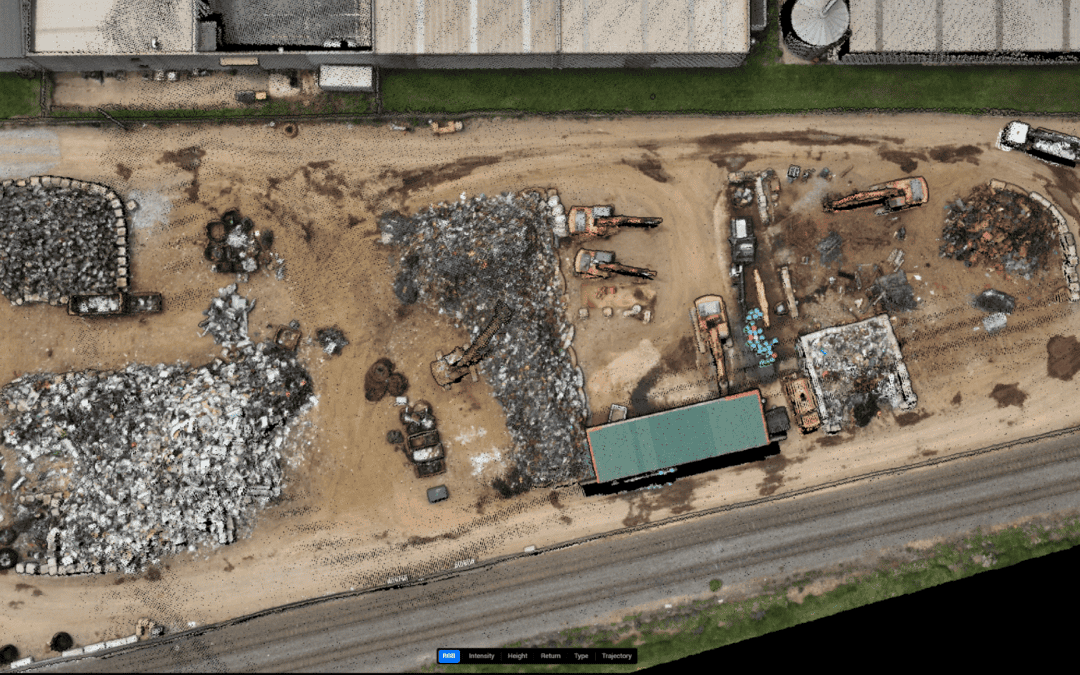
LiDAR stands for Light Detection and Ranging. Our DJI Zenmuse L2 sensor fires millions of laser pulses at the ground during the flight and measures precisely how long each pulse takes to bounce back. From that data, we build a 3D point cloud — a dense, accurate digital map of everything the laser hit: the ground, the stockpiles, the retaining walls, the machinery parked nearby, all of it.
The image above is what that looks like on our controller screen in real time as the drone flies the site. Every coloured dot is a laser return. Millions of them, building a precise picture of the terrain below.
The L2 system we use has manufacturer-stated accuracy of 4cm vertically and 5cm horizontally. Combined with RTK (Real-Time Kinematic) GPS corrections running live during the flight, our volumetric results come in within +/- 2% of true volume — the industry benchmark for aerial LiDAR surveys.
To put that in perspective: on a 3,000m³ stockpile, we’re talking about a maximum error of 60m³. A manual survey of the same pile could be off by 300-450m³. That difference in accuracy has real financial implications when you’re buying, selling, or reporting on bulk material quantities.
How We Ran This Survey
We flew the DJI Matrice 350 RTK at 70 metres above ground level, at 10 m/s with 50% lateral overlap between passes. The LiDAR was set to repetitive scan mode with triple return — meaning each laser pulse captures up to three return signals, which is particularly useful for sites with complex material surfaces where a single return might miss detail.
The resulting point cloud density was 1.89cm per pixel — extremely high resolution for a site of this scale. Processing was done in DJI Terra, where we classified ground points from stockpile points, manually delineated the base of each pile, and calculated volumes using a TIN (Triangulated Irregular Network) model.
For three of the five stockpiles, we also had to account for retaining wall blocks that were included in the scanned volume. We physically measured each block type on site and deducted the total block volume:
- Stockpile 1: 20 concrete blocks — 12.72m³ deducted
- Stockpile 3: 58 concrete blocks — 36.89m³ deducted
- Stockpile 5: Mixed irregular blocks — 12.56m³ deducted
Without deducting these wall volumes, the client would have received inflated material quantities — which could affect inventory valuations, sale transactions, or resource consent reporting. The detail matters.

Getting the Weight Right — Not Just the Volume
Volume alone is only half the picture for most bulk material businesses. What they actually need is weight — how many tonnes of material they’re holding. And this is where generic industry density tables fall short.
The standard approach is to look up a material’s bulk density in a reference table and multiply by volume. That works reasonably well for uniform materials like dry sand or crushed limestone. But recycled and mixed materials — like those at this facility — have variable densities depending on their specific composition, moisture content, and how they’ve been processed.
So we did it properly. On the day of the survey, we physically filled circular bins with material from each stockpile, weighed them on site, and calculated a material-specific bulk density for each pile. The density factors we used ranged from 0.141 tonnes/m³ for the lightest material up to 1.014 tonnes/m³ for the densest — a sevenfold difference. Using a generic reference table would have produced wildly inaccurate weight estimates across most of these piles.
It’s the kind of detail that separates a report you can actually use from one that just looks good on paper.
The Results
Here’s what we measured across the five stockpiles:
- Stockpile 1: 3,192.81m³ | 450.18 tonnes
- Stockpile 2: 283.42m³ | 167.50 tonnes
- Stockpile 3: 1,430m³ | 873.73 tonnes
- Stockpile 4: 1,976.91m³ | 891.58 tonnes
- Stockpile 5: 265.94m³ | 269.67 tonnes
Total: 7,149.08m³ across five stockpiles.
The client received a detailed report with annotated orthomosaic imagery, individual stockpile visualisations, site-specific density calculations, and full methodology documentation — everything needed for inventory management, site reporting, and operational planning.

Who Needs This Kind of Survey?
LiDAR stockpile surveys are relevant for any New Zealand business managing bulk materials:
- Quarries and aggregate suppliers tracking extracted and stored volumes
- Recycling and waste processing facilities managing material inventory
- Civil contractors needing cut/fill calculations on earthworks sites
- Port and logistics operations managing bulk cargo stockpiles
- Forestry operators tracking wood chip and biomass volumes
- Farmers and rural landowners measuring grain, silage, or soil stockpiles
- Mining operations requiring regular inventory reporting
If your business holds, moves, or sells bulk material — and you’re currently measuring it with GPS walking, manual estimation, or not measuring it at all — a LiDAR drone survey will almost certainly pay for itself in improved accuracy on the first job.
Want to Know What’s in Your Stockpiles?
We’re based in Christchurch and carry out LiDAR volumetric surveys across all of New Zealand. If you manage bulk material stockpiles and want accurate, defensible volume and weight data, get in touch for a free quote. We’ll tell you exactly what’s involved, what it will cost, and what you’ll get back.
No obligation — just a straight conversation about whether a LiDAR survey makes sense for your site.
📞 0800 DRONES (0800 376 637)
🌐 dronesatwork.nz/civil-volumetrics
Written by Art Ryumin, Operations Manager | Quantity Surveyor, Drones At Work Limited — CAA Part 102 Licensed.
Need your stockpiles measured?
We serve commercial, industrial, farmers and residential clients across all of New Zealand — from Christchurch to Auckland and everywhere in between. Get in touch today and we’ll have a quote back to you fast.